And unemployment dropped drastically after December 7, 1941!
Menzie seems oblivious to the fact that millions of Americans were drafted into the military during the war (mightn't that render the unemployment rate during the war, somewhat moot?). At the end, in 1945, there were over 12 million men and women in uniform, and probably about the same number working as civilians in war industry and government. In a country with a total population of about 140 million.
Once Germany and Japan have surrendered almost all those jobs end, and the people are suddenly back in the civilian work force. Now we're able to measure unemployment...for 1946 (according to the NBER) it averages 3.9%--about half what it is today.
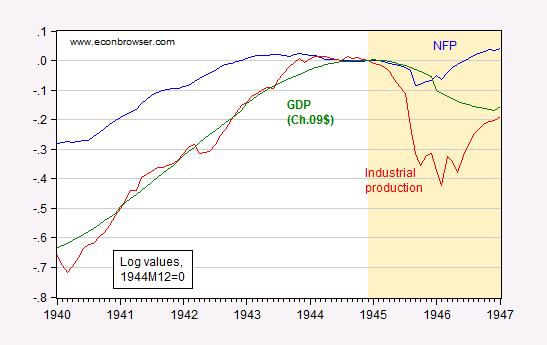
So, to answer Menzie's question; despite your desperate attempts to divert attention from the graph (and what is industrial production — chopped liver?) Yes, the graph that shows the dip (the plunging red line above) in industrial production is, in fact, to use a WWII era metaphor, chopped liver. It's an anomaly representing the switch from war to civilian production.
And notice that in Menzie's lovingly created graph, that industrial production begins to rise in ...1946.
Don't believe us? How about the word of someone who lived through it;
“[A]t the end of 1946, less than a year and a half after V-J day, more than 10 million demobilized veterans and other millions of wartime workers have found employment in the swiftest and most gigantic change-over that any nation has ever made from war to peace.” —Harry S. Truman, Economic Report, January 8, 1947, p. 1

No comments:
Post a Comment