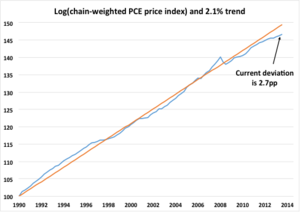

The graphs are from Stephen Cecchetti and Kermit Schoenholtz's blog. The one on top shows the deviations from trend inflation, while the bottom one shows the same for nominal GDP (NGDP). What we find odd, is the conclusion they draw from the two;
Looking at the data through the first quarter of 2014, we see that the price level [top graph] is now 2.7 percentage points below the 2.1% pre-crisis trend. By contrast, nominal GDP [bottom graph] is a whopping 15.6 percentage points below the 5.1% trend.
In practical terms, the top panel means that overshooting a 2% inflation target (or a 2.1% inflation target) to get back to the 1990-2007 price path would be relatively straightforward. It could be achieved by running inflation at 3% temporarily for three years and then returning to the 2.1% path.
The bottom panel shows that getting back to the pre-crisis nominal GDP path is a completely different story. To return to the previous trend within three years, policymakers would need to aim at nominal GDP growth in excess of 10 percent annually. That’s a pace of growth that we haven’t seen since 1984, when the recent era of low inflation began.We suppose that if your goal was 2.1% inflation, come hell or high water, then they have a point. But the goal ought to be to restore economic activity to its normal level. Which their two pictures seem to show won't happen by targeting the price level (by following a 'Taylor Rule').
After all The Fed has been targeting 2% inflation for years--along with an acceptable level of unemployment--more or less successfully, but that didn't prevent the huge drop in economic activity (NGDP) in 2008. The question seems to be, obviously; Had the Fed been targeting NGDP directly, what would have happened to NGDP?
No comments:
Post a Comment